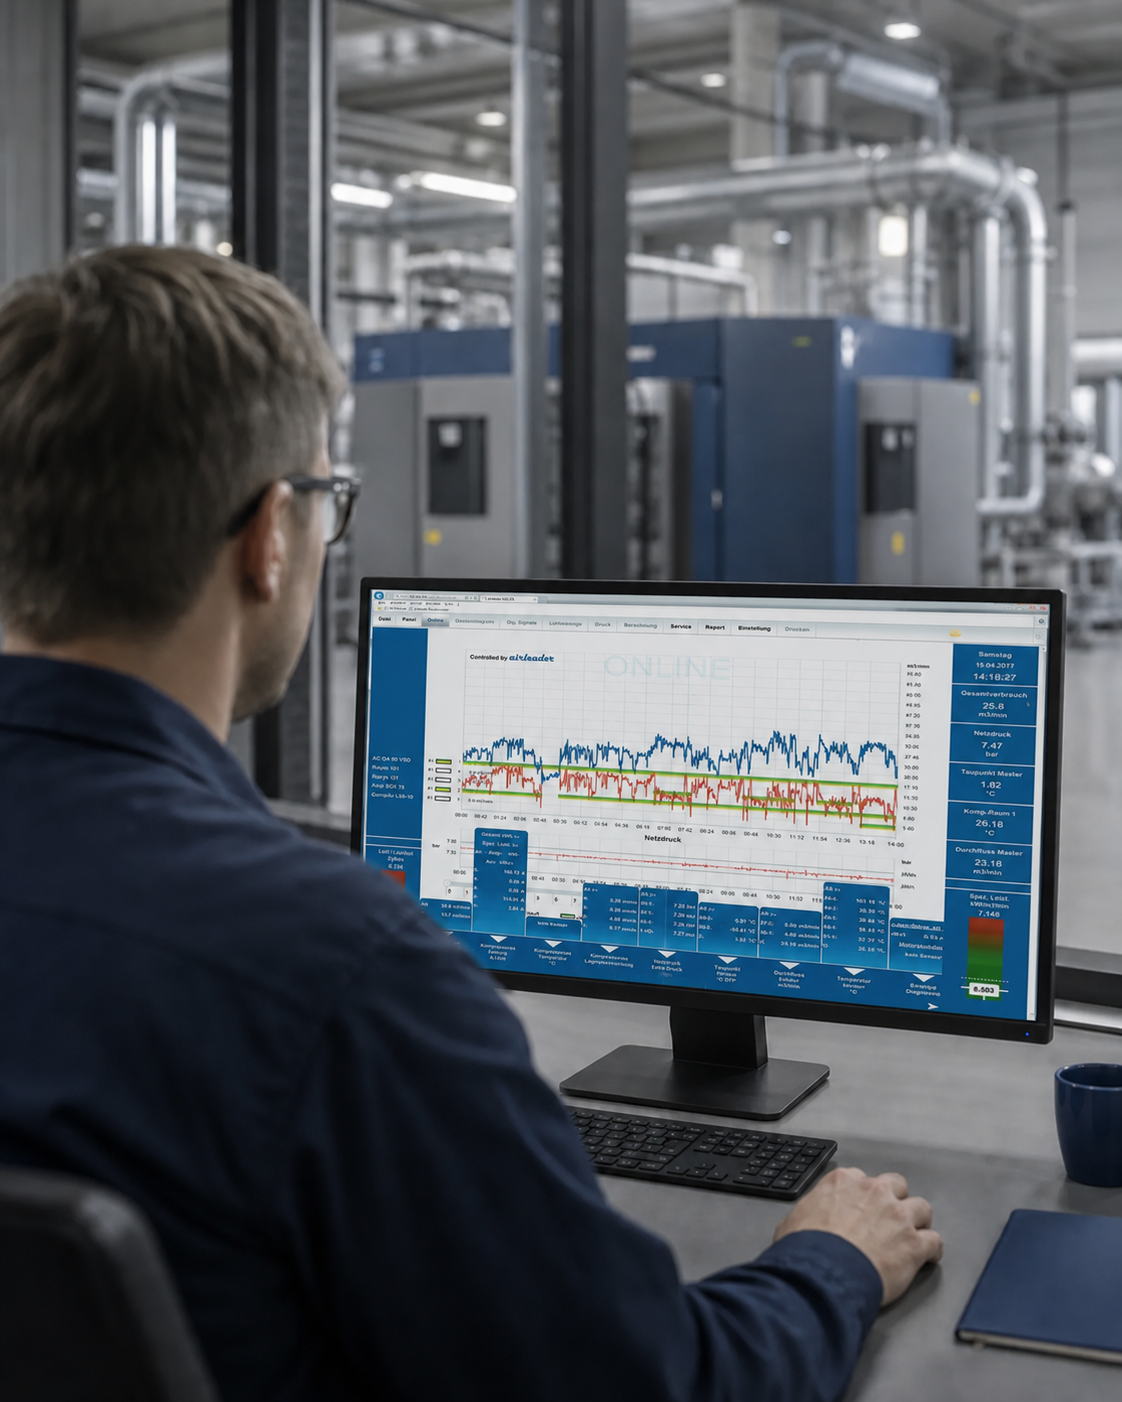

DETAIL
Common timeline
Pressure, volume flow, machine states and VSD flow capacities can be explained directly with each other.
 +49 7044 911 100
Produkte · Web-Visualisierung
Airleader führt Regelung, Messwerte, Kosten, Qualität und Wartung in einer lokalen Web-Visualisierung zusammen. Von der Live-Situation bis zum Langzeitvergleich.
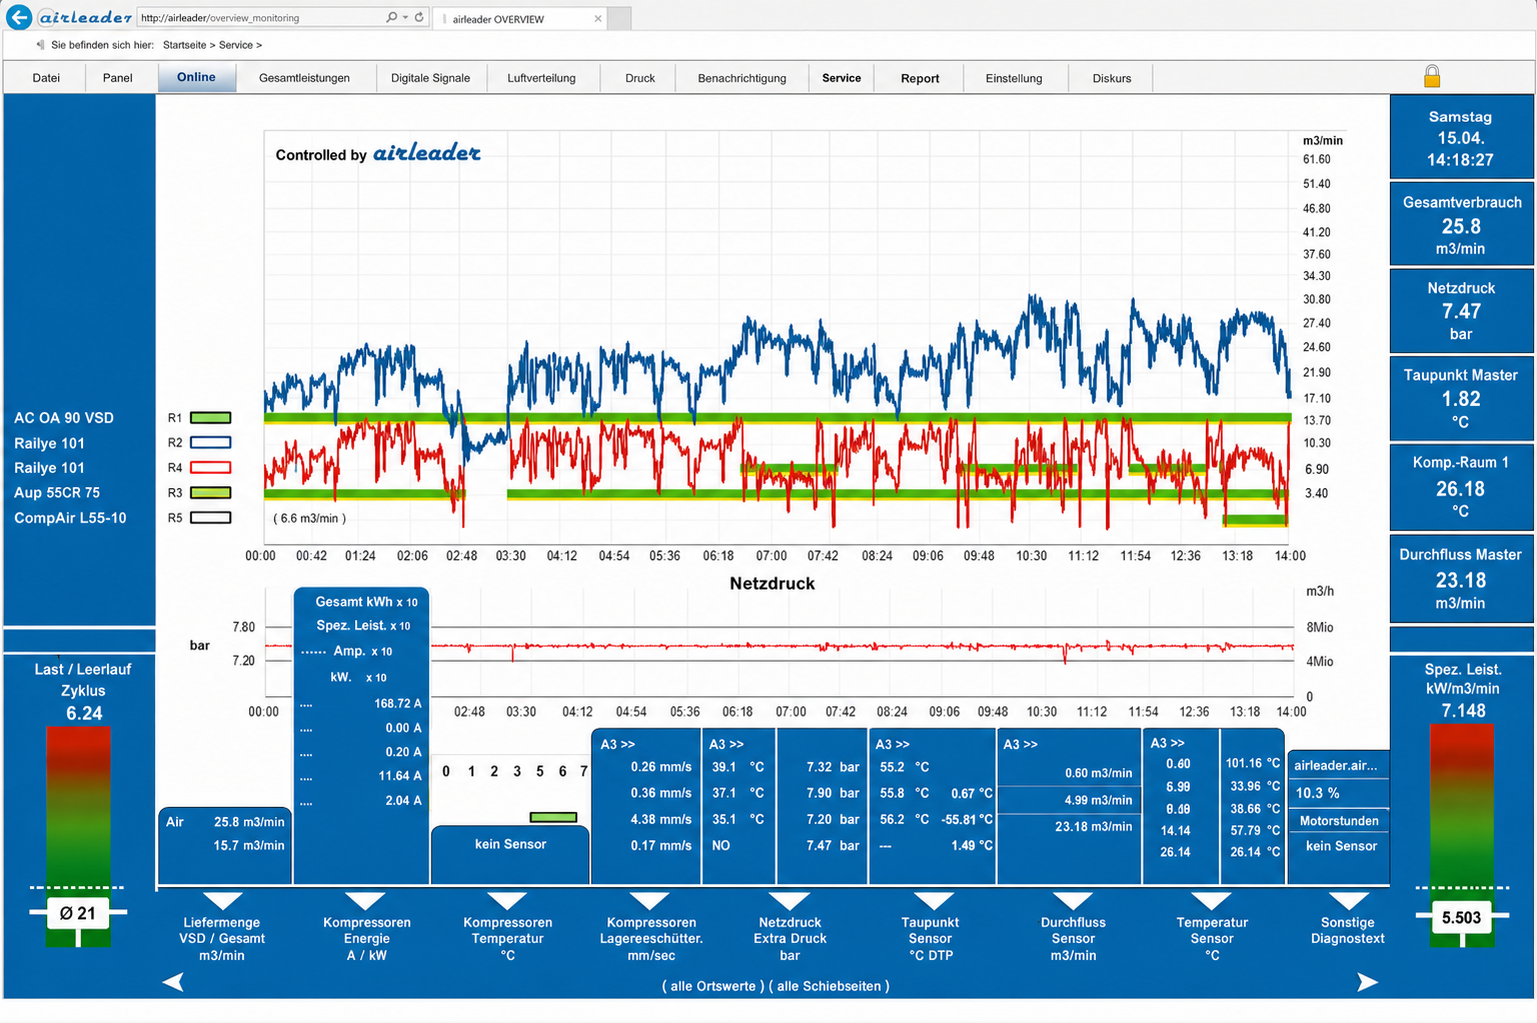
General overview
Das Gesamtdiagramm legt Netzdruck, Verbrauch und Zustände aller Kompressoren auf eine Zeitachse. Spitzen, Leerlauf und Schaltfolgen werden so unmittelbar lesbar.
Pressure, volume flow, machine states and VSD flow capacities can be explained directly with each other.
From the current operation to the enlarged hour window, the connection is maintained.
The Panel Designer can be used to compile relevant sensors and key figures for roles or areas.
Energy & Data Report
Für wählbare Zeiträume verdichtet der Bericht Laufzeiten, Energie, Luftmenge, Kosten, Schaltungen und spezifische Leistung – mit gemessenen Werten statt Typenschildannahmen.
Load and idle kWh, m3 generated and cost per compressor and station.
Specific performance in kWh/m3 or kWh/(m3/min) makes periods comparable.
Engine starts and load-idle circuits show unnecessary dynamics and maintenance influence.
Data can be used for energy management, documentation and further evaluation.
Predictive maintenance
Elektrische Leistung, Öl- und Kühlwassertemperatur, Lagerbewegung und Druckverhalten machen schleichende Defekte sichtbar – im Kontext des realen Betriebs.
High power when the flow capacity is too low may indicate a not fully opening intake regulator.
Drift and recurring overtemperatures become visible before protective shutdowns occur.
Changes in the bearing can be observed in a trend-based manner and specifically examined.
Not only interval, but condition and actual load determine the next step.
Alarm and Service
Airleader bündelt Störungen, Grenzwertverletzungen, Wartungsstände und Reaktionen. Damit wird aus einer Meldung ein nachvollziehbarer Vorgang.
Time, signal, course and receipt remain traceable.
Operating hours and service intervals of all integrated machines are centrally visible.
Dryers, filters, steam traps and other messages also belong in the station screen.
History and measurement course give the support before a supervised session the necessary context.
Interfaces and Export
Airleader provides measured and determined station data for higher-level systems and integrates external measured values. Software and hardware interfaces connect the compressed air station with building control technology, energy management and documentation.

The Modbus server outputs operating states, sensor values, consumption and messages in a standardized protocol description. Airleader reads in external sensors directly via Modbus data integration.

The OPC server provides process data to the second as OPC objects for control and energy management systems. OPC UA enables platform-independent communication over standard networks.
Export of data

Data archives can also be stored on USB without available visualisation. They can then be used for offline analysis or for simulations; in addition, firmware updates and add-ons are imported via USB.

Compressor data and energy calculations can be exported directly to Excel or Word and processed in reports.

A daily file contains the recordings and evaluations of the Airleader at 10-second intervals and is archived in a space-saving manner.
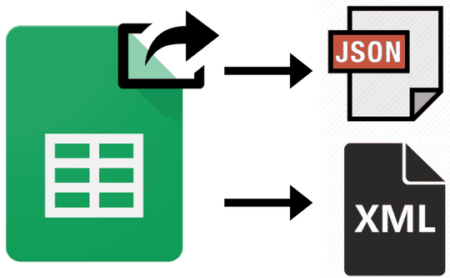
Depending on the application, in addition to CSV, further file- and web-based formats are available for different target systems.
Other connections

Online values and meter sums such as operating hours, load hours, volume flow and energy can be transferred to energy or visualization systems. Communication with compressor modules is also possible.
External sensors can be integrated via fixed wiring, bus interfaces or the network and evaluated together with the station data.
Data flow
Airleader collects states, consumption, energy, messages and connected sensor values in a common time reference.
Measured values are stored, visualized and provided as archives, tables or standardized process data.
Building control technology, energy management, visualization or documentation receive the required values and formats.
Data sovereignty
The visualization runs on the customer's own server; backups and accesses remain under your control.
Data is also stored in the Airleader hardware memory, so that interruptions do not immediately lead to gaps.
Exports and industry standards involve Airleader systems in energy, building and control systems.
Initial technical consultation
In 30 minutes we clarify the station, load situation and the most sensible next step – free of charge and without preparation.