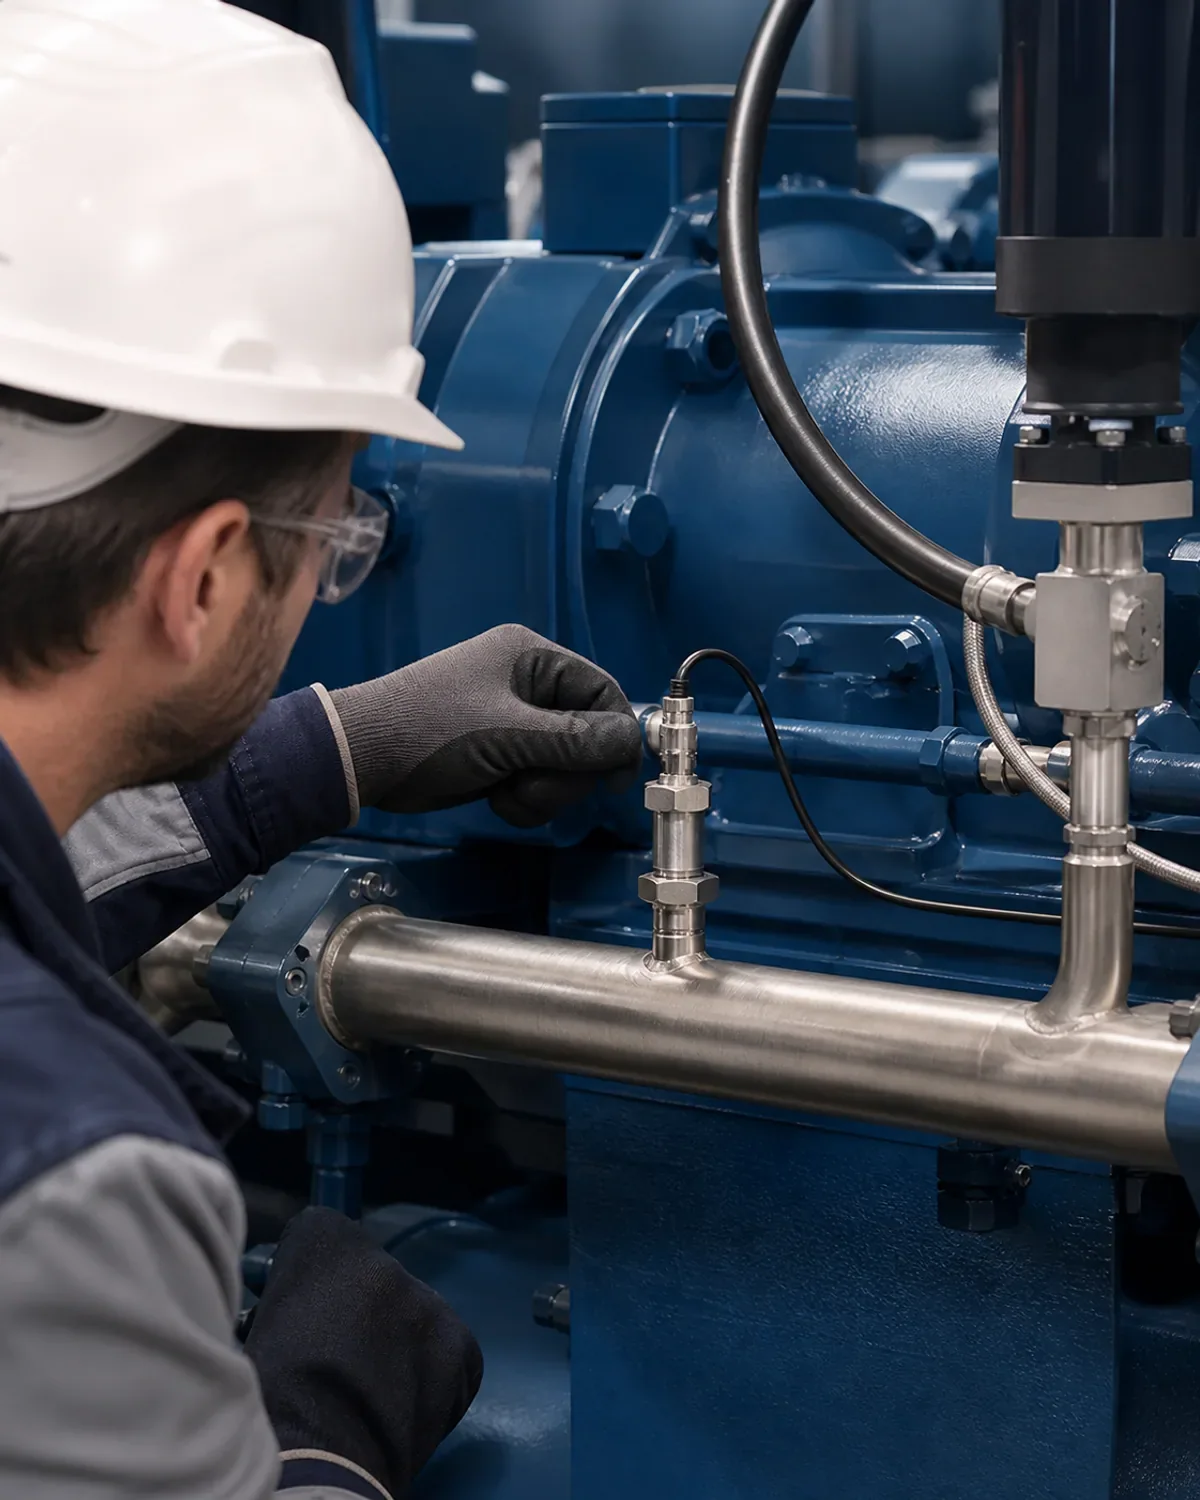

DETAIL
Contaminated or blocked coolers
If oil or outlet temperatures rise at a comparable load, contaminated radiator surfaces, added airways or a faulty fan can limit the heat dissipation.

Products · Sensors · Oil and cooling water temperature
Temperature trends show whether cooling and lubrication are stable before limit shutdowns or accelerated wear occur.
Why monitor?
Temperatures respond early to changes in heat dissipation, friction and operating conditions. Together with load, ambient temperature and running time, they help distinguish a brief peak from gradual deterioration.
If oil or outlet temperatures rise at a comparable load, contaminated radiator surfaces, added airways or a faulty fan can limit the heat dissipation.
Unusual feed and return temperatures indicate too low a volume flow, deposits in the heat exchanger, valve faults or a disturbed pump.
Slowly rising oil temperatures may indicate changes in oil quality, increased friction or permanently unfavorable operating conditions.
In practice
The temperature at the airend outlet shows the thermal load where the compressed air and oil mixture is hottest.
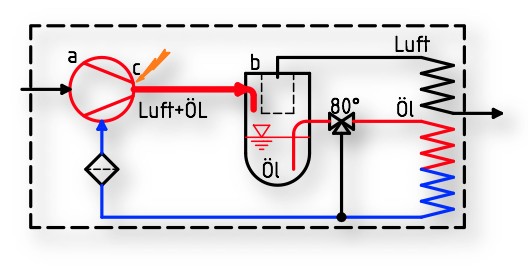
Legend: a = airend; b = oil separator; c = compressed air and oil outlet, the hottest point of the compressor. Original diagram with German labels.
Original measurement report; source units and scales are retained in the image.
Open full-size imageIn practice
The installation example shows the temperature sensor at the compressed air and oil outlet, together with the oil separator and airend.
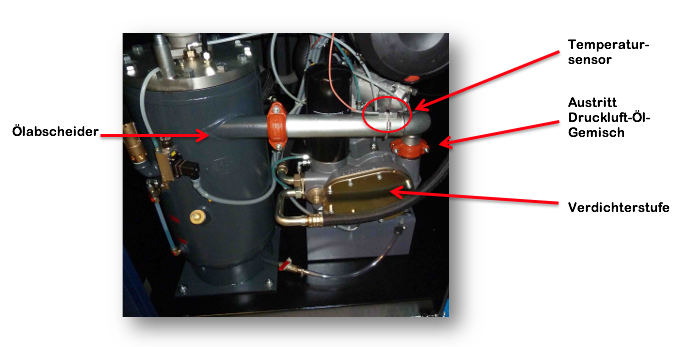
Installation example with German annotations.
Original measurement report; source units and scales are retained in the image.
Open full-size imageIn practice
Start-up, stable operation and cooling can be distinguished on the same timeline. Alarm limits are set for the individual machine.
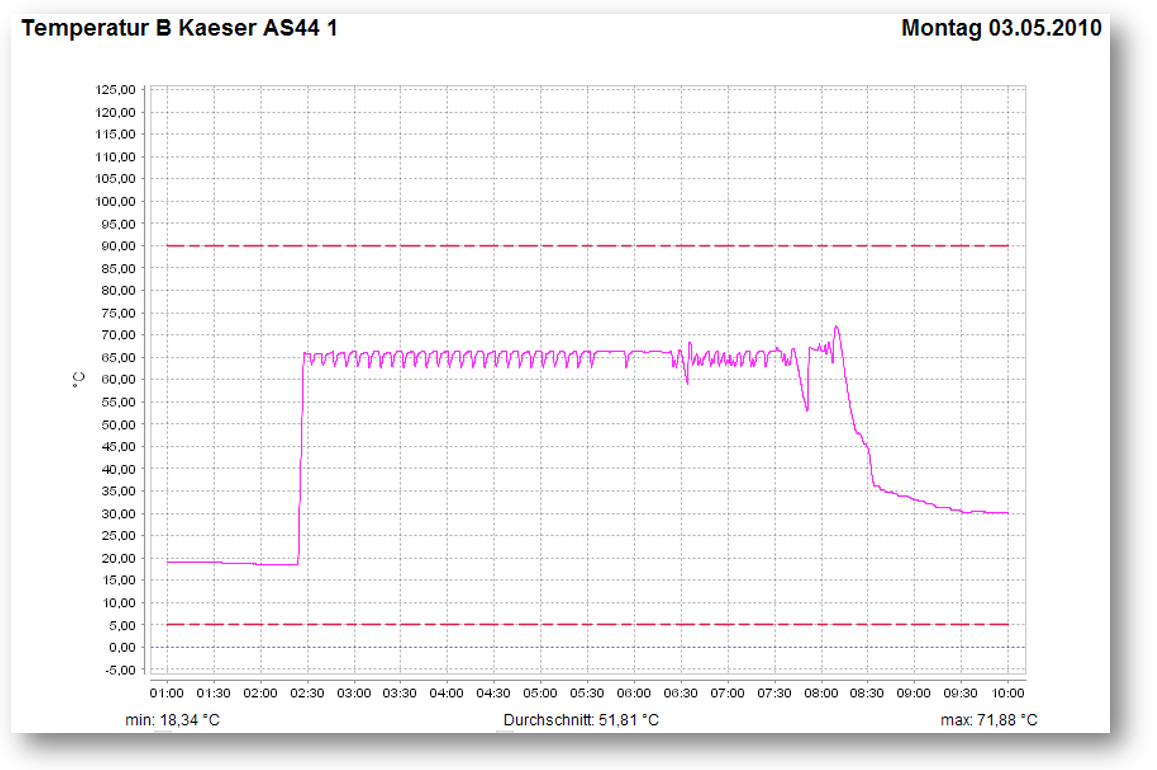
Historical example curve: maximum 161.38 °F. The limits shown are not general temperature recommendations. Original chart with German labels.
Original measurement report; source units and scales are retained in the image.
Open full-size imageIn the Airleader system
Current measured value and status are visible directly in the web visualization.
10-second averages make deviations, shifts and recurring patterns comparable.
limit violations are reported; Values are included in energy, quality or maintenance certificates.
Initial technical consultation
In 30 minutes we clarify the station, load situation and the most sensible next step – free of charge and without preparation.