

DETAIL
Detect incipient bearing wear
A permanently rising vibration level or new frequency components can indicate damage to raceways, rolling bodies or lubrication.

Products · Sensors · Bearing and vibration monitoring
Severe bearing damage often develops over time. A reliable trend helps identify changes before they become audible or cause a shutdown.
Why monitor?
Vibration reveals mechanical changes well before they cause noticeable noise, heat or failure. Comparison at similar speed and load matters more than a single instantaneous reading.
A permanently rising vibration level or new frequency components can indicate damage to raceways, rolling bodies or lubrication.
Speed-dependent patterns help to limit unbalance, clutch errors or misalignment of engine and compressor.
Sudden or load-dependent changes can occur due to loose attachments, foundation problems, pipe forces or resonances.
In practice
If a bearing fails, the rotors can contact each other or the housing. These damage examples show why an unusual vibration trend deserves early investigation.
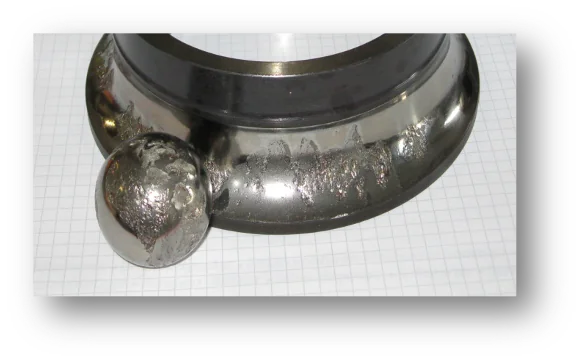
Visible damage to the raceway and rolling elements of a removed bearing.
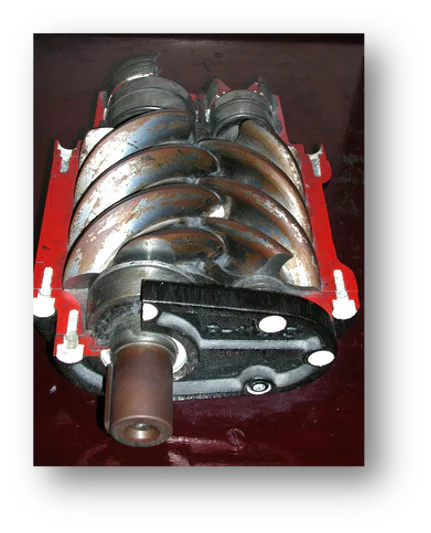
Bearing damage can cause severe consequential damage to the screw rotors.
In practice
The installed vibration sensor detects changes directly at the machine. In Airleader, readings are compared at similar speed and load, and suitable alarm limits are configured.
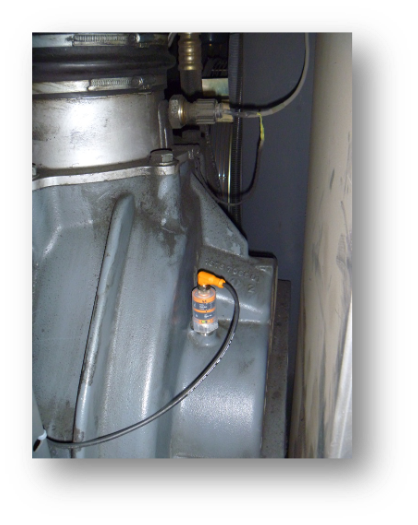
Installation example from an existing system.
Original measurement report; source units and scales are retained in the image.
Open full-size imageCase study presentation
The presentation documents vibration trends before a bearing failure and shows installation, alarms and lessons from the case.
In the Airleader system
Current measured value and status are visible directly in the web visualization.
10-second averages make deviations, shifts and recurring patterns comparable.
limit violations are reported; Values are included in energy, quality or maintenance certificates.
Initial technical consultation
In 30 minutes we clarify the station, load situation and the most sensible next step – free of charge and without preparation.