
DETAIL
Untapped thermal potential
If the compressor runs, but hardly any heat is removed, a consumer, a suitable control or sufficient operating hours on the heat side may be missing.

Products · Sensors · Heat meters for heat recovery
Heat recovery delivers verifiable savings when usable heat and operating hours are measured.
Why monitor?
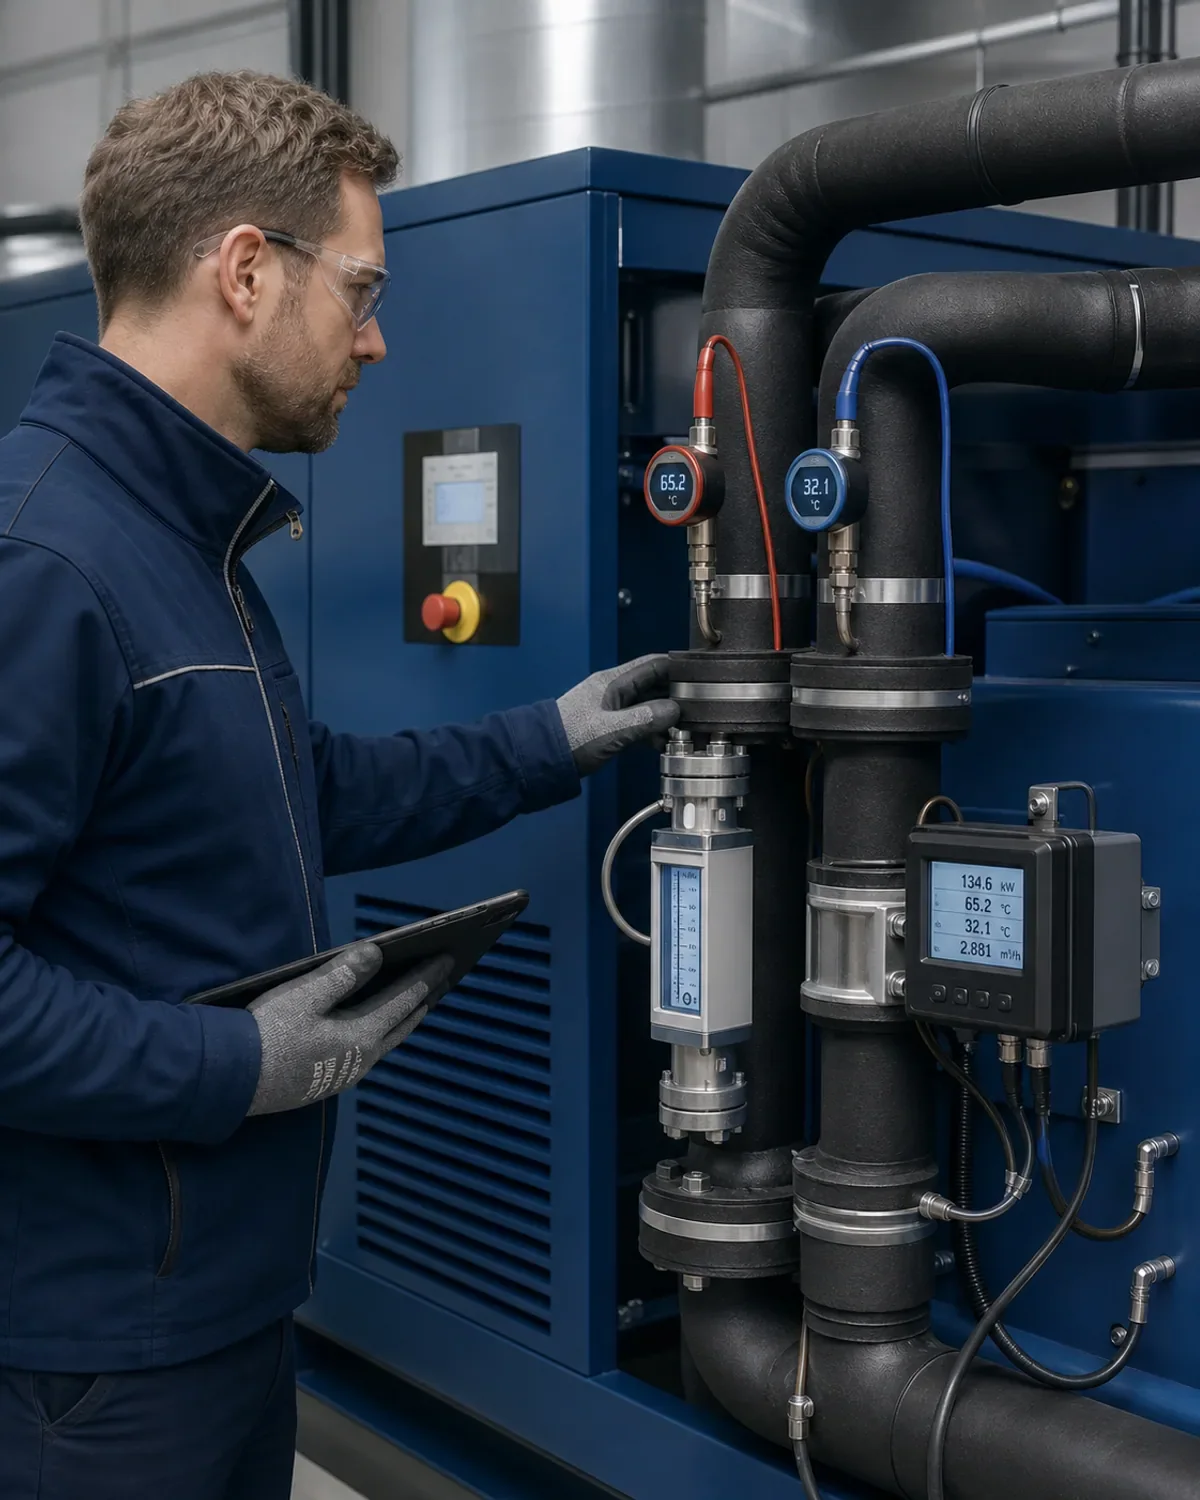
Flow rate and supply and return temperatures determine the heat actually transferred. This reveals whether the heat generated by the compressor is used in the heating or process system.
If the compressor runs, but hardly any heat is removed, a consumer, a suitable control or sufficient operating hours on the heat side may be missing.
Too little temperature spread or falling thermal output can indicate a contaminated heat exchanger, incorrect hydraulics or too little water flow.
High return temperatures, frequent valve limitation or highly fluctuating decrease show that accumulators, pumps and consumers do not match the available heat.
In practice
Much of the electrical input becomes heat. Actual utilisation depends on temperature levels, heat consumers and operating hours.
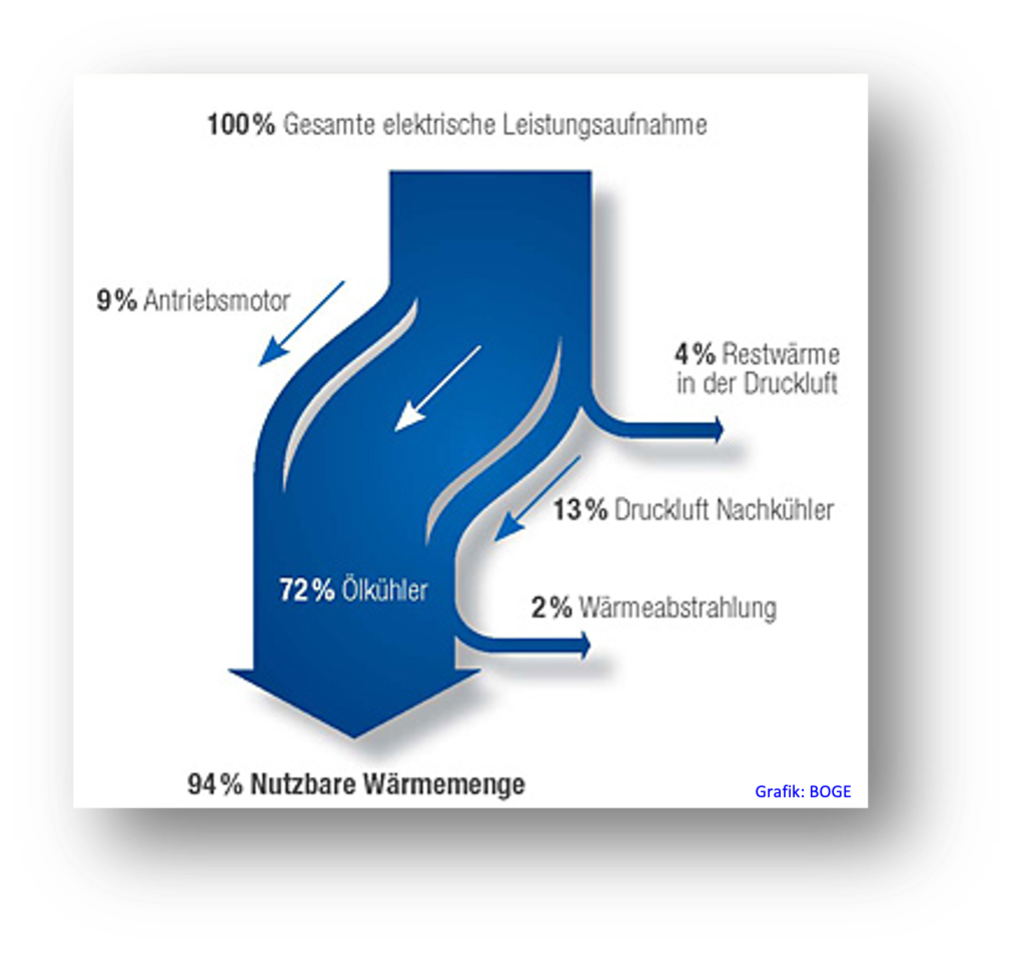
Graphic: BOGE. Illustrative energy balance: 72% oil cooler, 13% aftercooler, 9% drive motor; together 94% potentially usable heat. This is not a guaranteed recovery rate. Original diagram with German labels.
Original measurement report; source units and scales are retained in the image.
Open full-size imageIn practice
The visualisation shows instantaneous heat output in kW. Transferred heat is totalled in kWh for daily, weekly and monthly balances.
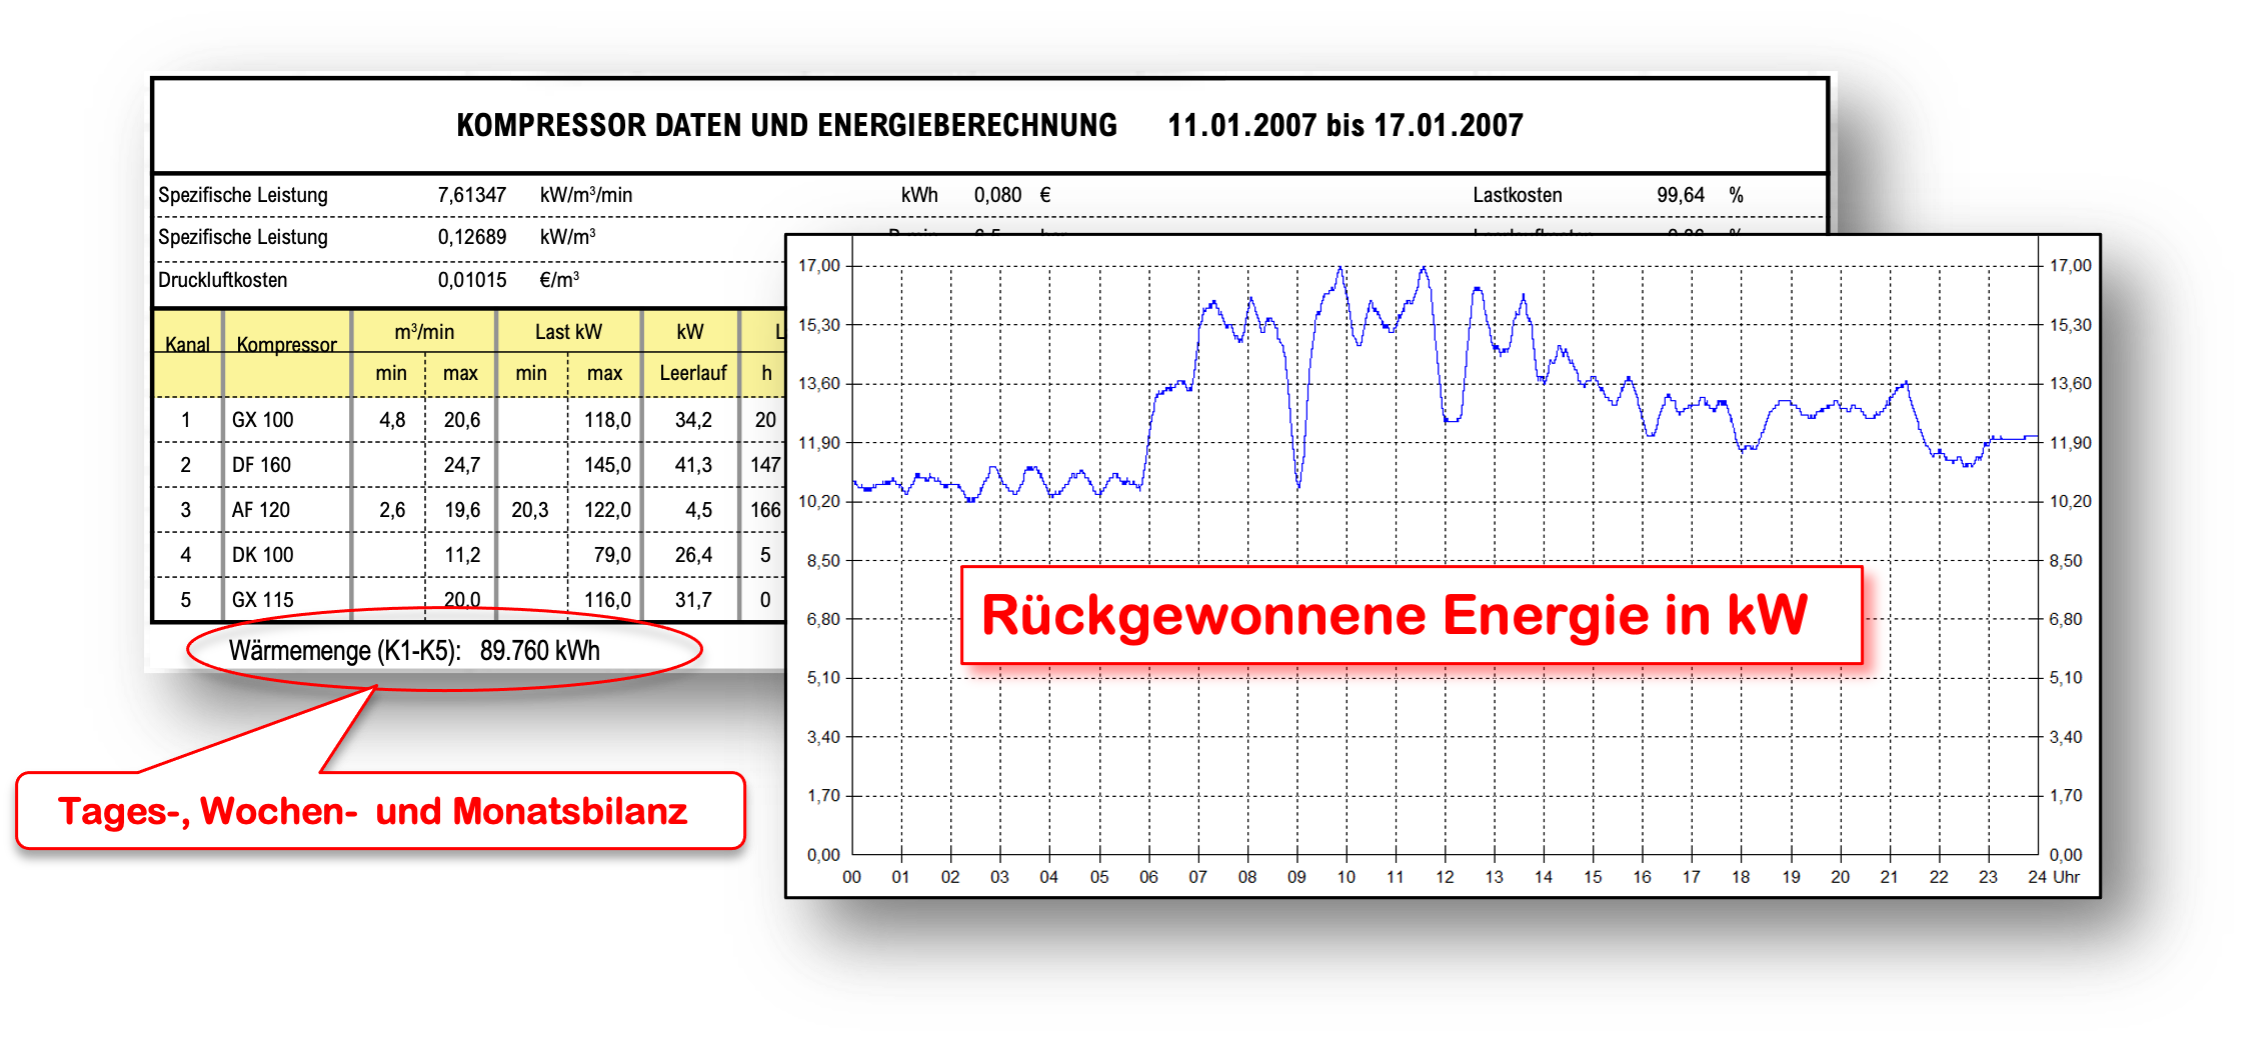
Historical example report from 11 to 17 January 2007; prices and readings relate to that example system at that time. Original report with German labels.
Original measurement report; source units and scales are retained in the image.
Open full-size imageIn the Airleader system
Current measured value and status are visible directly in the web visualization.
10-second averages make deviations, shifts and recurring patterns comparable.
limit violations are reported; Values are included in energy, quality or maintenance certificates.
Initial technical consultation
In 30 minutes we clarify the station, load situation and the most sensible next step – free of charge and without preparation.