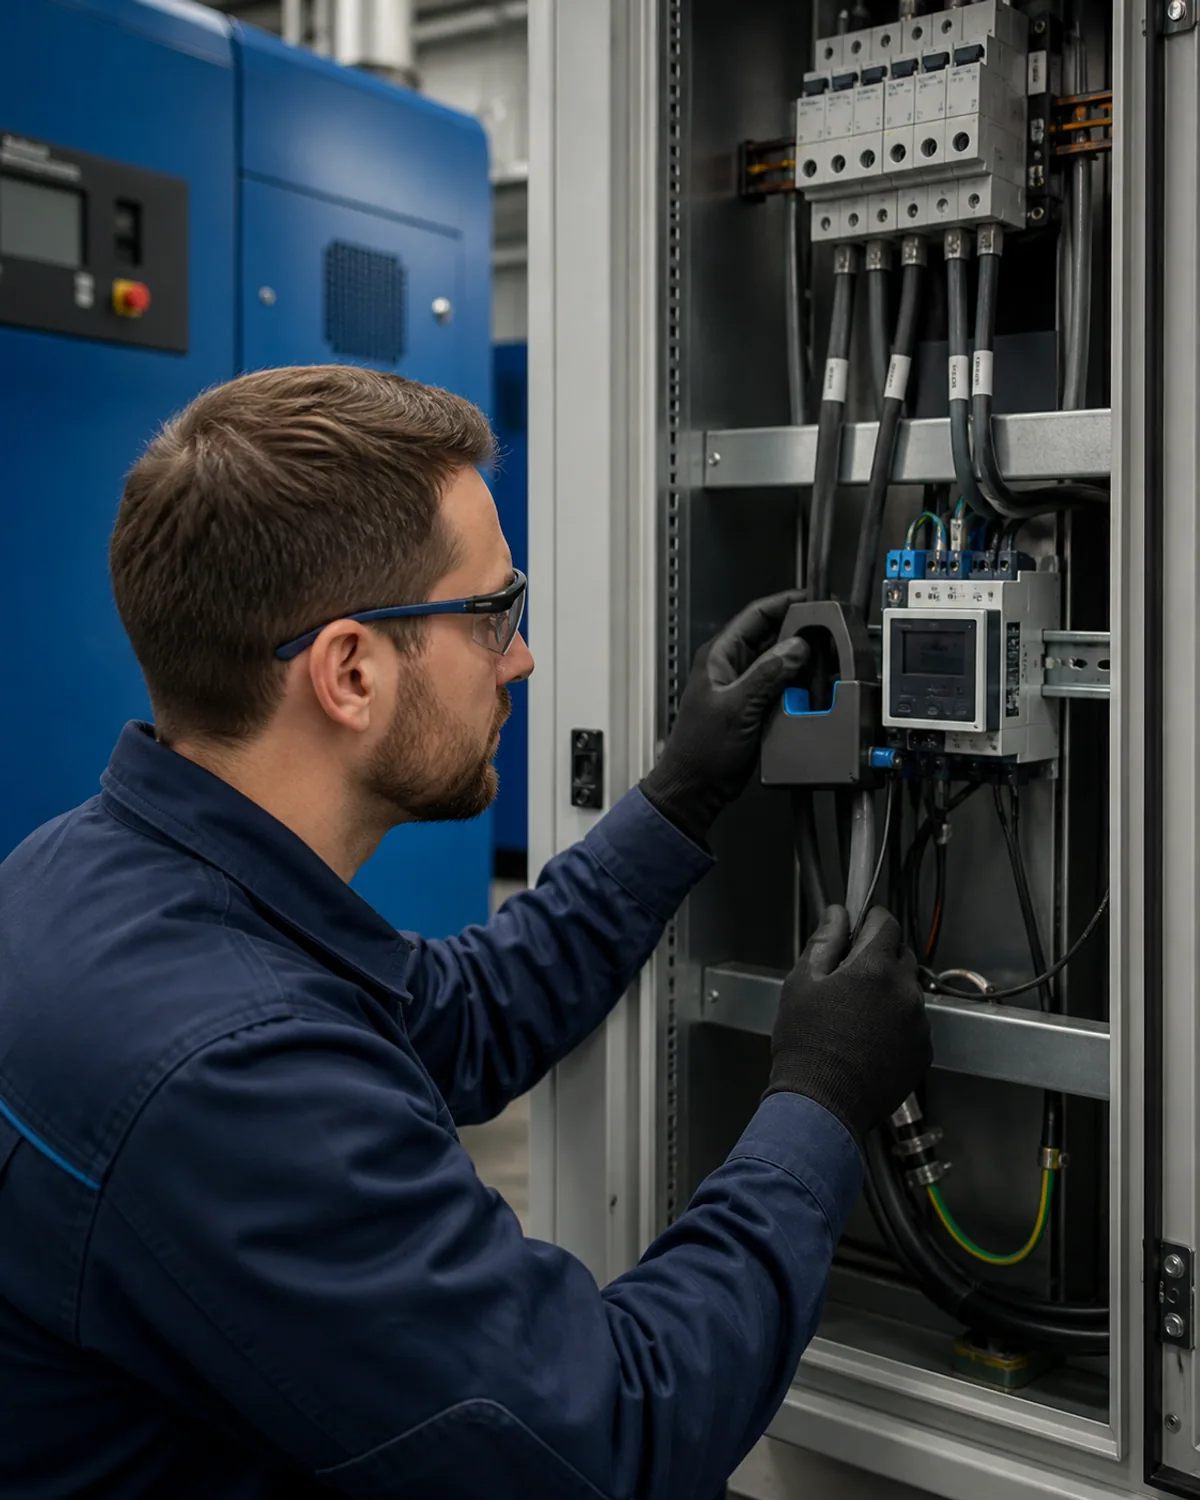

DETAIL
Detecting unproductive idling
High power consumption without a corresponding flow capacity shows long idle phases, unnecessary discharge or an inappropriate switching strategy.

Products · Sensors · Current and power measurement
Measured electrical power reveals load, idle operation and signs of faults – and provides the basis for reliable energy and cost figures.
Why monitor?
Electrical power consumption shows how much energy a compressor needs in each operating state. Combined with air output, pressure and the load signal, it reveals whether that energy is actually converted into useful compressed air.
High power consumption without a corresponding flow capacity shows long idle phases, unnecessary discharge or an inappropriate switching strategy.
Rising kW per m3/min generated make excessively high system pressure, wear or unfavorable operating ranges measurable before they are only noticeable on the electricity bill.
If the output changes during comparable operation, a sluggish intake regulator, increased mechanical friction or a problem in the drive train can be behind it.
Identify operating states
A compressor draws different amounts of current during start-up, load and idle operation. Correctly configured current thresholds help distinguish these operating states.
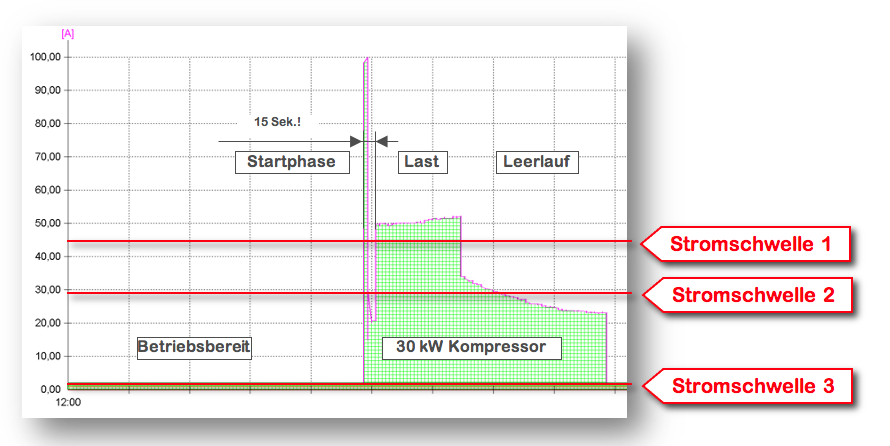
Example of a 30 kW compressor: start-up is followed by load operation, then current falls during idle operation. Thresholds must be configured for the individual installation. Original diagram with German labels.
Original measurement report; source units and scales are retained in the image.
Open full-size imageThe brief current peak during start-up is considered separately from normal load operation.
The current curve shows when the compressor delivers air and when it continues running without useful air output.
Current in amperes indicates the operating state. Reliable energy and cost figures require electrical active power in kW to be recorded over time.
Evaluate energy and costs
The report combines run times, energy used during load and idle operation, and compressed-air output for each compressor. The configured electricity price allows costs to be allocated and machines to be compared.
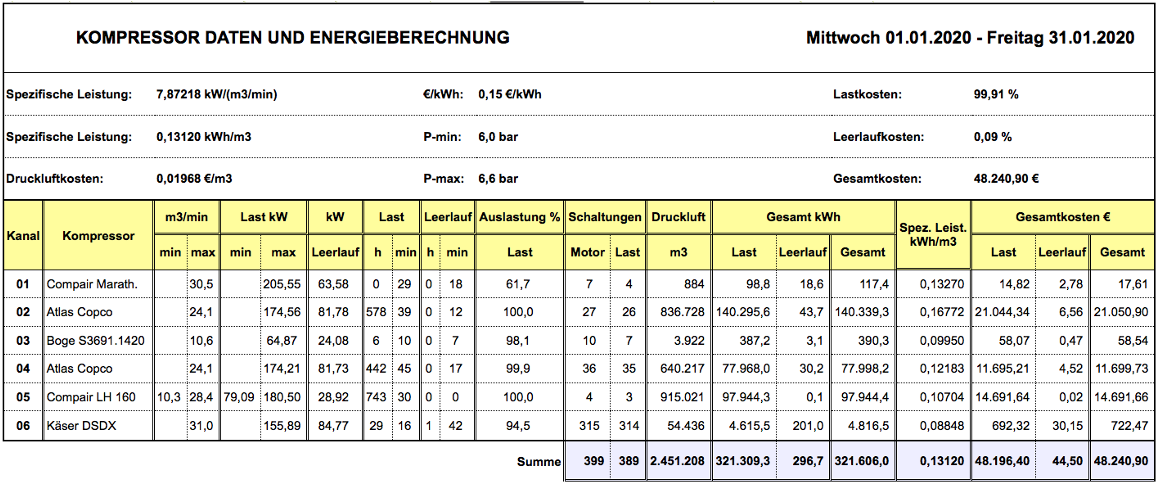
Historical sample report for 1–31 January 2020 using an electricity price of €0.15/kWh. The consumption and cost figures apply to this example installation. Original report with German labels.
Original measurement report; source units and scales are retained in the image.
Open full-size imageSeparate energy and cost figures for load and idle operation show where energy is consumed without producing compressed air.
Specific energy consumption in kWh/100 ft³ relates consumption to compressed-air output. Comparisons are made under similar pressure and operating conditions.
Regular reports show how run times, utilisation and energy consumption change after optimisation.
Investigate anomalies
If power consumption changes at a comparable air output and the same pressure, the mechanical components are worth checking. The diagram shows possible inspection points between the intake and motor.
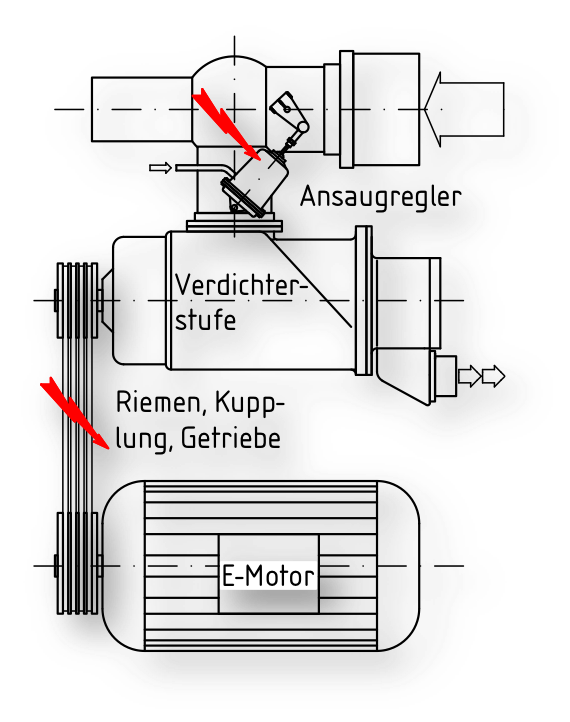
Possible inspection points: intake regulator, belt, coupling and gearbox. An unusual reading indicates a need to investigate; the cause is established at the machine. Original diagram with German labels.
Original measurement report; source units and scales are retained in the image.
Open full-size imageIf the regulator does not open fully, air output may fall while electrical power consumption remains high.
Additional friction or power transmission problems can change the relationship between power consumption and air output.
Power, air output, pressure and operating state together help focus the inspection.
In the Airleader system
Current measured value and status are visible directly in the web visualization.
10-second averages make deviations, shifts and recurring patterns comparable.
limit violations are reported; Values are included in energy, quality or maintenance certificates.
Initial technical consultation
In 30 minutes we clarify the station, load situation and the most sensible next step – free of charge and without preparation.