Understand compressed air. Keep the entire station under control.
This fundamentals training takes you from the first “What is a bar?” to understanding how Airleader operates multiple compressors as one coordinated system.
STATION · LEARNING MODEDemand and generation in balance
AUTO
NETWORK PRESSURE6,42 bar
DEMAND39 m3/min
K0116m3/minK0216m3/minK038m3/min
NETWORK
01 MEASURE02 CALCULATE03 COORDINATE
Your outcome
After the course, you will be able to interpret a compressor station from a new perspective.
01Identify the components, pressure and air flow in a compressed-air system.
02Explain how loaded operation, idle operation, demand and system pressure interact in one cycle.
03Understand why a cascade creates a wide pressure band, idle operation and frequent switching cycles.
04Understand how Airleader measures demand, chooses combinations and demonstrates savings.
Scope of this training
We only consider compressors with a fixed speed.
Variable speed compressors – also VSD or VSD compressors – are deliberately not treated here. Their functioning and integration into a station are topics of advanced training.
System design, pressure band, costs and fixed-speed screw compressor.
A compressor draws in ambient air, compresses it and raises its pressure. Air treatment, storage and piping deliver it to the application at the required quality and pressure.
Components of a compressed air system
Every component affects supply reliability, air quality and energy consumption.
01Intake filterProtects against particles
02CompressorCompresses the air
03After-coolersReduces air temperature
04PreparationDried and filtered
05Storage and networkBuffered and distributed
06ConsumersUses the compressed air
Two quantities accompany us throughout the training: The Pressure p describes how much the air is compressed, typically in bar. The Volume flow Q describes the amount of air per time, for example in m³/min. If the station delivers more volume flow than is consumed, the pressure rises; if it delivers less, it falls.
Why the pressure band is important
Balancing reliable supply, system inertia and the lowest possible pressure.
The consumer specifies the required minimum pressure. The compressors together must deliver enough air so that the pressure remains between p_min and p_max. The container and pipe network store air: if the flow capacity is greater than the consumption, the pressure rises; if it is smaller, it falls.
7,06,56,0 bars
p maxcurrent pressurep minTime is
pressure band too narrow
Even small pressure changes trigger load-idle cycles. Start-up times, valve movements and the effective network volume create inertia—so the number of switching cycles rises.
pressure band too wide
p_min must reliably supply consumers. If p_max is set unnecessarily high, compression work, leakage losses and consumption by unregulated applications increase.
Fixed-speed screw compressor
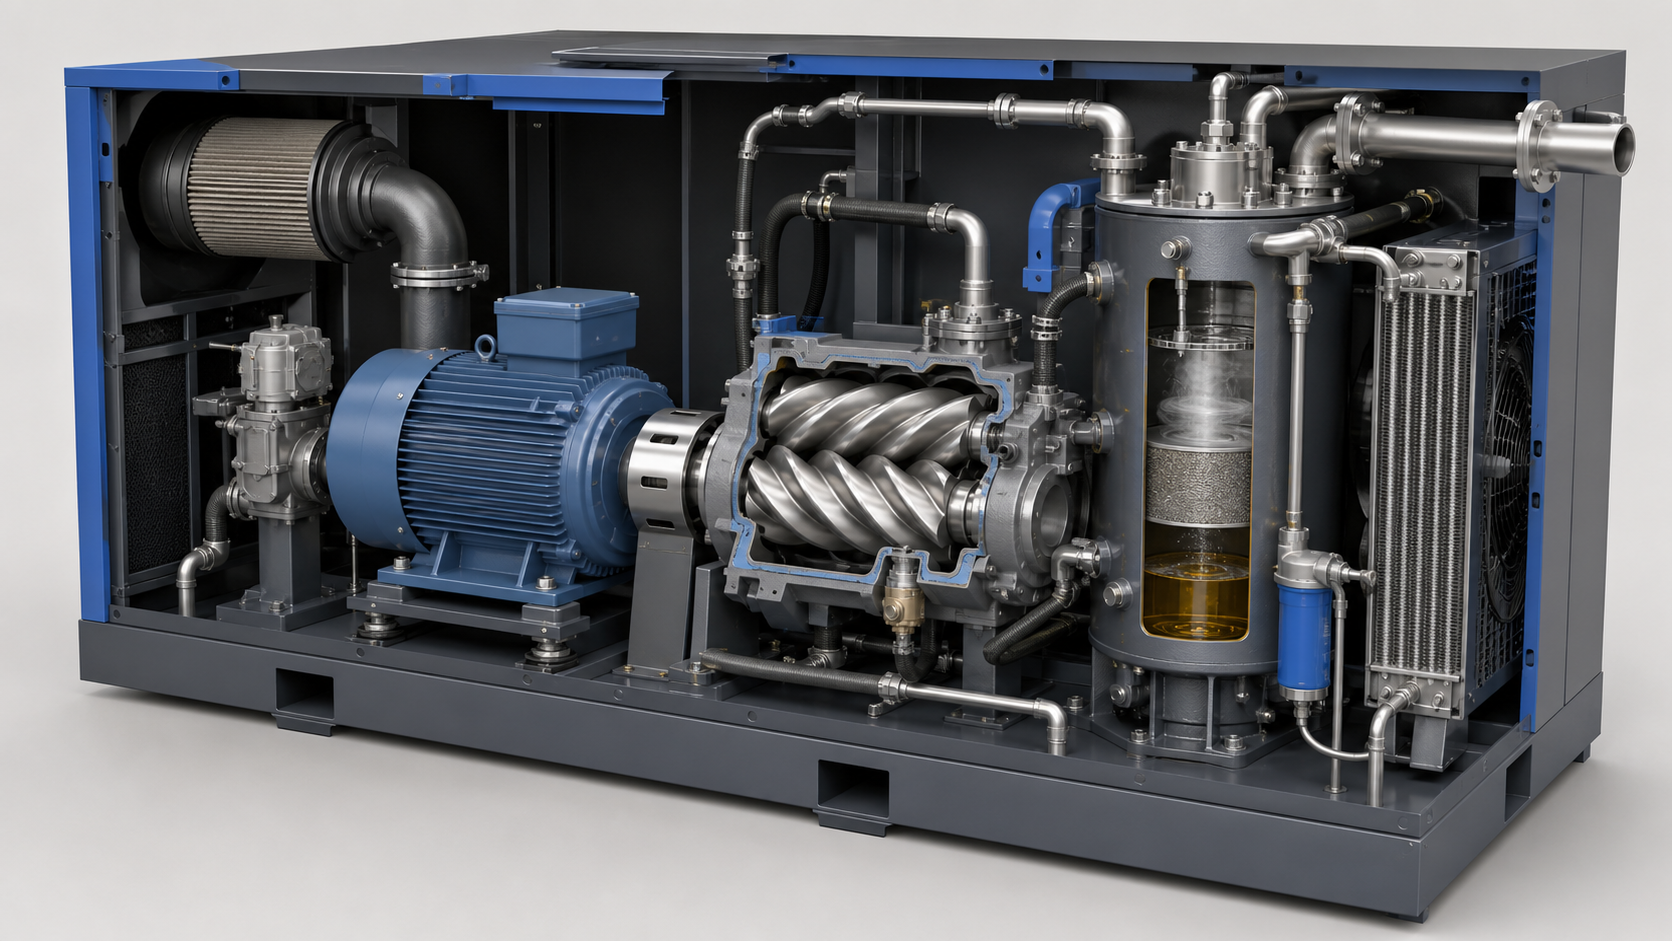
Construction and airway of an oil-lubricated screw compressor.
The electric motor runs at a fixed speed. Two interlocking rotors trap air and reduce the available space; this increases the pressure. The inlet valve determines whether the screw block sucks in and delivers air.
0102030405
01Intake filter and intake valve
The filter retains particles. During load running, the inlet valve is open; during idling, the intake is closed or relieved.
02Electric motor
The motor drives the screw block at a fixed speed and continues to run during load and idle.
03Screw block
The two rotors trap air. The enclosed volume becomes smaller, the pressure increases.
04Oil separator
The injected oil cools, seals and lubricates. It is then separated from the compressed air and recirculated.
05Aftercooler and outlet
The compressed air is cooled and then flows into the treatment, container and pipe network.
Inlet openLoad: full flow capacity→Inlet closed / relievedIdle: practically no useful airContinue to load and idle ↓
!
Safety first: Compressed air is stored energy. This training is not a substitute for operating instructions. Pipes, containers and machinery may only be opened or modified after release, pressure relief and manufacturer specifications.
Cost over 10 years
Example calculation for a station with four speed-fixed compressors.
40 m³/min total supply, 8,760 operating hours per year, a specific energy requirement of 0.114 kWh/m³ and an electricity price of 0.10€/kWh are assumed.
Air quantity in 10 years40 × 60 × 8.760 × 10= 210,2 million m3Load energy costs210,2 million × 0,114 × 0,10 €≈ € 2.40 million
Investment200.000 €6,3 %
Loaded-operation energy2.400.000 €75,6 %
Idling energy316.000 €10,0 %
Service160.000 €5,0 %
Wear100.000 €3,1 %
Total costs3.176.000 €
Load and idle energy combined: round 85,5 %.
Knowledge check
Which quantity describes the volume of air delivered per unit of time?
02
Operating modes and pressure cycle · 14 min
Load and idle
A fixed-speed compressor meets demand by alternating between loaded and idle operation.
A fixed-speed compressor cannot continuously adjust its flow capacity to demand. When loaded, it delivers its full air flow; when idling, it supplies virtually no useful air. The receiver and piping network buffer the difference: pressure rises to p_max and then falls back to p_min.
LOAD100% flow capacity
The compressor supplies compressed air. Its electrical power consumption is close to the rated load power.
⇄
IDLE≈ 0% flow capacity
The engine continues to run. As an orientation, the United States Department of Energy uses 20-30% of the load capacity for screw compressors.
→
READY / OFF0% flow capacity
After the discharge period, the engine can stop – if starting limits and supply allow.
Synchronous learning model
Drive the time hand through a fixed 10-minute cutout.
Loaded operation Idle operation Pressure
The compressor is fixed at 16 m³/min. The effective total volume includes boilers and the storage volume of the compressed air network.
1 · compressed air consumptionconstant 3 m3/min2 · compressor stateLoad 16 m3/min / idle ≈ 03 · system pressurep min 6 / p max 7 bar
At the selected timeIdle operation
System pressure
6.73 bar
Air balance
−3 m³/min from the network
Idle operation: demand empties the storage volume.
During idle operation, the compressor supplies virtually no useful air. Consumers continue to draw 3 m³/min from the effective system volume of 3 m³. The pressure therefore falls steadily towards p_min. The larger the total volume, the more slowly both pressure slopes change.
Pressure change with 3 m3 system volumeLoad: +4.33 · Idle: −1.0 bar/min
01It is stored in the load run.
10 m³/min Supply quantity minus 6 m³/min Consumption results in 4 m³/min excess. The system pressure rises to p_max.
02Remove at idling speed.
The delivery drops to almost zero. The constant consumption of 6 m³/min allows the pressure to drop to p_min.
03The pressure band controls the clock.
At p_max, the compressor control switches to idle, at p_min back to load. More effective storage volume extends both phases.
Try it yourself
How much does it cost to idle?
This orientation calculates only the electrical no-load power. Maintenance, starts and pressure level are also added.
Indicative value€29,700/ year
27.5 kW × 6,000 h × 0.18 €/kWh
Knowledge check
Why does system pressure rise during loaded operation even though demand remains constant?
03
cascade circuit · 12 min
Cascade without central control
At higher consumption, several compressors are operated in parallel.
If the flow capacity of a compressor is no longer sufficient, further machines are connected in parallel. Without higher-level control, each local individual control remains responsible for itself. A simple cascade therefore assigns each machine its own offset pressure band.
01Each machine measures the same net pressure.
But each controller knows only its own switching points—not the station's total demand.
02The pressure bands are staggered.
Thus, the compressors are loaded one after the other when the pressure drops instead of simultaneously.
03The station oscillates over all belts.
A significantly wider station pressure band is created from several local pressure bands.
pressure bands of a cascade
Each individual controller receives its own switching points.
If the pressure drops, the compressors are successively loaded at their staggered p min values. If it rises again, they relieve their respective p max values.
Pressure
5.86.06.26.46.66.87.07.27.47.6
Order
K01Base load
p min 6.41.0 barp max 7.4
loads first
K02Follower load
p min 6.21.0 barp max 7.2
loads next
K03Peak load
p min 6.01.0 barp max 7.0
maintains minimum pressure
Lowest limit6.0 barspecified by the consumer
resulting station pressure band: 1.4 bar
Uppermost border7.4 barCreated by staggering
01Consumption is increasing
The system pressure drops.
→
02undershoot p min
The next individual controller requests load.
→
03Consumption decreases
The pressure rises to the staggered p_max values.
The lower limit is not freely selectable
p min is specified by the consumer.
Machines and tools require a safe minimum pressure at the connection point. After pressure losses in preparation and lines, the lowest switch-on limit must therefore not be lowered further. In order to stagger the compressors anyway, the other pressure bands move up – and thus the highest p max.
Why less pressure counts
Only as high as necessary – but always safe.
An unnecessarily high system pressure increases the compaction work and in the case of unregulated applications additionally increases the consumption. The fist range is approximately 6-10 % extra cost per bar; Real value depends on investment and consumers.
The fixed sequence only roughly solves the quantity problem.
01Wide pressure band
Staggered pressure switches require a distance. The station pressure oscillates over a larger area.
02Idle operation
The last machine switched on only covers the tip and waits in between with the engine running.
03Frequent switching cycles
Large jumps in capacitance cause the pressure to rise and fall quickly. The machine changes more often between load and idle.
04Artificial consumption
Higher pressure also increases the amount of air extracted in the case of unregulated consumers and leakages.
Another cascade problem
Switched is always the next compressor of the fixed order.
A cascade cannot dynamically select the volumes that best fit the needs. This is why many stations consist of machines of the same size – although graduated sizes could affect consumption more accurately.
Why does the highest p_max often increase in a simple cascade control system?
04
Station comparison · 12 min
The control challenge
Two stations meet the same demand – but with different compressors and pressure profiles.
On the left, a simple cascade switches the machines in fixed order. On the right, a central control system views the entire station and selects a more suitable combination from 16, 16, 8 and 4 m3/min. Move the regulator and compare selection and pressure dynamics.
Direct comparison
One need, two control strategies.
Left · simple cascadeFixed order
32m3/min switched5 m3/min on demand
K0116m3/min
K0216m3/min
K038m3/min
K044m3/min
Right · Centrally controlledAppropriate selection
28m3/min switched1 m3/min on demand
K0116m3/min
K0216m3/min
K038m3/min
K044m3/min
Common time basis30 minutes
Calculated with 30 m³ effective storage and line volume.
Left · simple cascadewide pressure band, rapid changes
p min 6 barp max 7.2 bar
Right · central controlnarrow pressure band, gradual changes
p min 6 barp max 6.3 bar
Why the Right is Better
Central control brings generation and demand closer together.
More suitable, smaller compressors cover the current demand with less surplus supply and lower energy consumption.
Slower pressure changes produce a flatter sawtooth. This allows the station to operate in a narrower, more efficient pressure band.
Fewer load-idle cycles Reduce the number of circuits and wear on the motor, contactors and intake control.
Less idle time means less energy consumption without generated useful air.
Didactic model with four fixed-speed compressors: 16, 16, 8 and 4 m³/min. The time axis and pressure change are calculated with an effective storage and line volume of 30 m³. Real decisions also take into account efficiency, minimum runtimes, reserve and machine condition.
Knowledge check
Why can several efficient compressors operate inefficiently as a group?
05
Airleader principle · 11 min
How Airleader coordinates the station
A higher-level controller coordinates the station according to the current requirements.
The higher-level controller knows the flow capacities, states and operating limits of the connected compressors. The current demand is evaluated from the network pressure and pressure gradient – and a suitable combination is selected.
01Measure
Capture system pressure, pressure change, states, performance and optionally direct flow.
→
02Calculation
Evaluate consumption, dynamics, available capacity and safety reserve.
→
03Select
Determine the appropriate compressor combination and trim compressor.
→
04Testing
Observe response, detect deviations and adjust the next decision.
01 · Fewer shifts
Suitable combinations calm the station.
If the switched flow capacity is closer to the demand, the pressure changes more slowly. Airleader can massively reduce the number of load-idle changes. This reduces energy-intensive idle times and protects the motor, contactors, valves and intake control.
Less energy without useful air
Less mechanical and electrical wear
02 · Sensor monitoring
The entire station remains constantly in view.
Sensors can monitor not only the compressors, but also pressure, volume flow, electrical power, processing and other relevant components. If limit values are violated or deviations are detected, the system can issue alarms.
Detecting disruptions and trends earlier
Report alarms to responsible persons in a targeted manner
The common pressure band remains narrow – regardless of the number of compressors.
A higher-level controller continuously monitors within the narrow pressure band whether more or less air is required. It can then selectively switch on or off compressors.
The station therefore does not have to wait until p_min of the built-in control of another compressor is reached. The common band starts at the same lower limit as the cascade, but does not require individual bands staggered upwards.
A strategy for the station
What the central level additionally considers
The specific parameterisation depends on the system. The basic principle remains: supply reliability first, then as little pressure, idling and shift wear as possible.
Ranking profilesWhich machine leads, follows or remains reserve.
Change timesSimilar compressors are used in a balanced manner.
Switching sequenceFixed-speed compressors are switched on and off to meet current requirements.
Pressure profilesVarious target ranges for production, night or test operation.
MonitoringSensor values, runtimes, power, circuits and disturbances are visible to the overall system.
Knowledge check
What is the main objective of a higher-level station controller?
06
Potential analysis · 9 min
What can Airleader do for my station?
A measurement week makes the actual state visible; A simulation calculates the potential with Airleader.
Instead of calculating flat-rate savings values, a representative operating week is measured. For exactly the same consumption, it is then simulated which compressors Airleader would have chosen when – and how pressure, idle, shifts and energy would have changed.
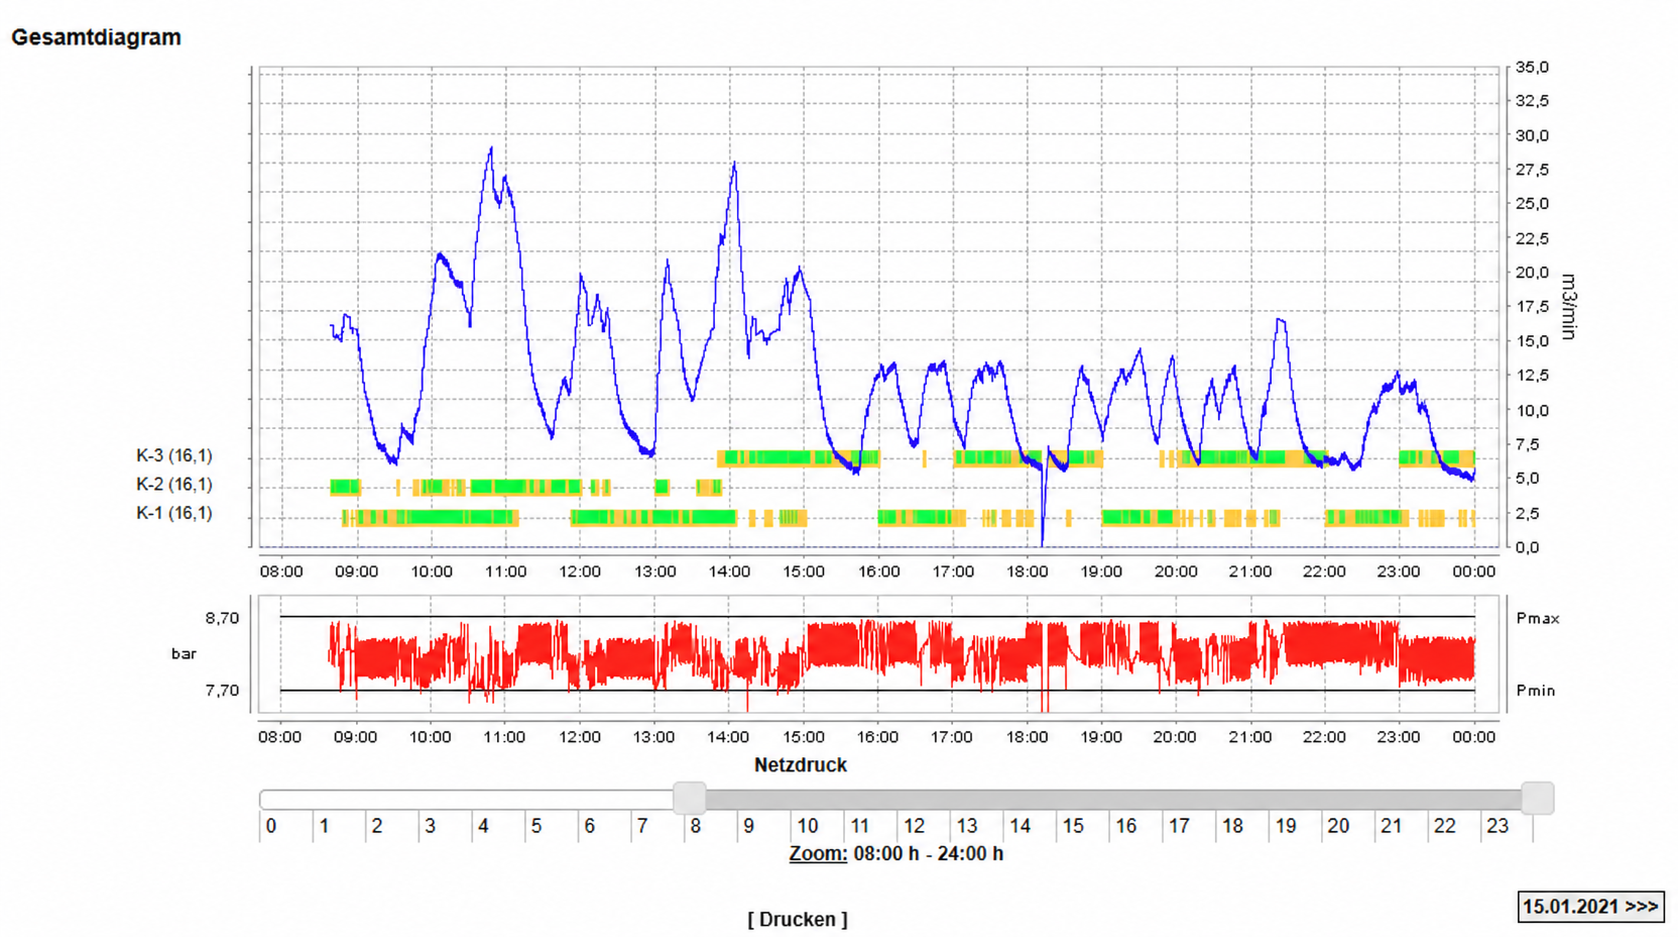
Daily section from a measurement week
Volume flow, compressor states and system pressure are recorded on the same time axis. The original diagram can be enlarged by clicking.
01Measure for one week
Pressure, volume flow, electrical power and machine states are detected simultaneously. The week should include typical shifts, stops, and peaks.
→
02Simulate the same week
The measured consumption remains unchanged. The model calculates which compressors Airleader would have chosen at each point in time and how the station would have reacted.
→
03Quantification of savings
Actual and simulation are compared at identical air output. Differences in kWh, idle, shifts, pressure and costs are shown in a comprehensible manner.
Measured actual condition
This is how the existing station ran.
Actual demand and system pressure
actual compressor states and switching cycles
measured loaded and idle energy
current specific energy requirements and costs
Simulation with Airleader
So the same week would have been centralized.
Same amount of air at the same times
More suitable compressor combinations
narrower, lower pressure band
calculated kWh, cost and wear effect
The resultA reliable business case for exactly this station – instead of a blanket savings promise.
The simulation transparently shows on which operating states the expected savings are based. After implementation, a new measurement can confirm the real before-and-after effect.
Your next stepPlanning the measurement week.
Together we define a representative period, the required measurement points and the evaluation variables. Then you get actual analysis, Airleader simulation and proven savings potential.
The learning structure is based on the Airleader basics presentation (March 2025). Technical statements were compared with current manufacturer information and neutral industry sources.

 0102030405